What a Number Won’t Say Until We Write It: Join Session 2 of Data Storytelling for Cultural Creatives
- Joseph Crown
- Mar 8
- 8 min read


When people hear “data storytelling,” they sometimes imagine charts behaving themselves and numbers lining up in tidy little rows, ready to explain the world. But local data rarely arrives that clean. It arrives partial, uneven, shaped by timing, trust, fear, disclosure, documentation, and all the things human beings carry into a room before they ever answer a question. That is exactly why this work matters.
Our next Data Storytelling for Cultural Creatives session, Reading Place Through Data, takes place on Wednesday, March 11, 2026, from 5:00 PM to 8:00 PM at NORAPC. This session is designed to help participants use place, context, and everyday evidence to read beyond the number itself and deepen the story. The three-session series is built to help people turn numbers and lived experience into clear, community-ready stories. You can find the link to register below.
One of the exercises we’ve been working with starts from choosing a single number. The number chosen here was in the 2024 New Orleans epidemiological profile: 107 people, or 40.53% of new HIV/AIDS diagnoses, were classified as “No Reported Risk.” In the broader prevalence data, 1,239 people, or 14.32%, were placed in that same category. That difference matters. It tells us that this category takes up a much larger share of newly diagnosed data than it does in the overall prevalence picture. And that opens the door to a more important question: what may be happening at or near diagnosis that makes the story harder to capture?
That category does not mean no risk existed. It means there was not enough reported information, at that moment, to assign an exposure category. The training guide makes that plain and pushes us to think about what may be shaping that silence: timing, trust, disclosure, privacy, question wording, documentation, follow-up, and whether the available categories even fit how people understand and describe their own lives.
And that is where writing begins.
Below is a short story developed from that number and shared with permission by an author who chose to remain unnamed:
Joining The 107
He sat in the exam room with a paper cup of water he hadn’t touched, listening as the nurse explained next steps and sliding a clipboard closer like the rest would be routine. The words “new diagnosis” still rang in his ears, loud enough that everything after sounded distant, like it was happening down the hall. Someone asked a question about how it might have happened, and he felt his throat tighten. Not because he didn’t have a life, or a history, or answers, but because this wasn’t the moment he could lay any of that down in a box. He didn’t know who would see it, how it would be used, or whether it would change how people looked at him the second he stood up and walked back into the world. He stared at the lines on the form, trying to translate a whole complicated life into a choice that didn’t feel like him, and finally he shook his head and said, “I don’t know,” even though what he really meant was, “Not yet.”
That is the work.
Memoir does this all the time. So does fiction. So does public health, whether it admits it or not. Every author decides what to foreground, what to leave implied, what silence means, what details belong in the frame, and what gets left on the cutting-room floor. Data packets do something similar. Reports highlight some things, flatten others, and leave us to make meaning from what is present and what is absent. We are constantly world-building with incomplete data, limited knowledge, and partial experience. We are constantly setting priorities from imperfect information.
That does not make the work useless. It makes the work human.
A number can show us scale, but not always setting. It can show us a category, but not always a life. It can show us that something is missing without telling us why it went missing in the first place. In this case, the training materials offer several grounded possibilities: someone may still be processing the shock of diagnosis, may not yet trust the setting, may not recognize themselves in the language being used, may not feel safe in a rushed or insufficiently private environment, or may have had their story reduced by workflow and documentation limits rather than by unwillingness alone.
That is one reason this next session matters so much.
We are not gathering to force neat answers out of messy lives. We are gathering to become better readers of the shared data landscape. We are practicing how to look at local numbers and ask better questions. We are learning how to write with data in ways that are more honest, more grounded, and more useful to community. We are learning how to notice what a number clearly says, what it does not yet say, who may be inside it, and what our systems, categories, and priorities may be failing to hear.
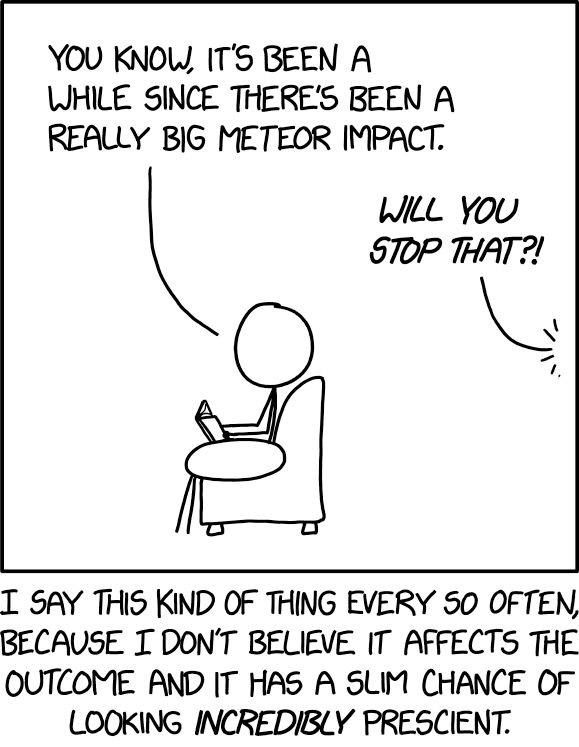
And yes, there is also room for humor, because sometimes that is how truth gets through the door.
The illustration above paired with this post gets at that perfectly: a room full of people announces that they received 500 survey responses and discovered that people love responding to surveys. Funny. Painfully funny. Also wise. It reminds us that all data comes from somewhere, and not everyone who could answer does answer. Every packet has a point of view. Every report has edges. Every number is already shaped by who showed up, who trusted the process, who felt seen by the language, and who threw the survey straight in the bin.
That’s not a reason to stop using data. That’s a reason to use it better.
Why This Series Matters
Too often, people are handed data without tools for understanding it—or without space to connect it to what they actually know, feel, and live. This series is built to change that.
At its heart is a simple but powerful practice:
Choose one number and explain what it means where we live.
That means learning how to look at a figure, ask what it says, ask what it leaves out, and then turn it into something human—something that can be spoken, written, illustrated, or shared in ways that make people care.
This is not about becoming a statistician. It is about becoming more confident in reading the world around you and shaping that knowledge into stories that others can understand and use.
What to Expect
Across the next sessions, participants will work through guided exercises, small-group discussion, writing time, and share circles designed to help them leave with actual work in progress—not just inspiration.
The series is designed to help you:
turn a number into a story seed
connect local data to lived experience and community knowledge
practice writing and shaping drafts with support
explore how voice, structure, and form change meaning
begin creating stories, visuals, illustrations, and narrative frameworks that can travel beyond the room
The sessions are practical, collaborative, and welcoming to people with different comfort levels around both data and creative work. Whether you are a writer, artist, organizer, advocate, or simply someone who wants to think more clearly about the numbers shaping our city, you are invited.
Who Should Attend?
This series is especially well-suited for:
cultural creatives
writers and storytellers
artists and illustrators
community advocates
Healthcare professionals creating messaging and content
Those interested in local data, public health, smoking, air quality, HIV, and Ryan White Priority Setting Sessions.
nonprofit staff
planners and organizers
people who work with lived experience and community knowledge
anyone who wants to make data more useful, more human, and more meaningful
You do not need to arrive as an expert. You just need curiosity, openness, and a willingness to practice.
Register Now
This is a chance to build practical skills, connect with others, and begin turning numbers into stories people can actually use.
Come ready to think, write, share, and create.
Meeting 2: Reading Place Through Data
In the second session, we deepen the work by thinking about place, context, and everyday evidence—how tables, maps, archives, and local knowledge help us read beyond the number itself.
Date: Wednesday, March 11, 2026
Time: 5:30 PM – 8:00 PM
Address: 2601 Tulane Avenue, Suite 400, New Orleans, LA 70119
Parking: Please use free street parking nearby. Do not park in the lots, as vehicles may be towed.
Finding us: Take the elevator to the 4th floor, then make a left when you exit. The office is located there.
Click here to Register:
Please register so we can prepare accordingly. Food, refreshments, and seating are being provided, and we are doing our best to get an accurate count for everyone attending.
Meeting 3: Form and Voice Clinic
The third session helps participants shape their work further—exploring voice, structure, and different creative pathways so each person leaves with stronger drafts and clearer next steps.
Date: Thursday, March 19, 2026
Time: 5:30 PM – 8:00 PM
Address: 2601 Tulane Avenue, Suite 400, New Orleans, LA 70119
Parking: Please use free street parking nearby. Do not park in the lots, as vehicles may be towed.
Finding us: Take the elevator to the 4th floor, then make a left when you exit. The office is located there.
Click here to Register:
Please register so we can prepare accordingly. Food, refreshments, and seating are being provided, and we are doing our best to get an accurate count for everyone attending.
Want to preview the agenda for these sessions?
You can view it here: https://drive.google.com/file/d/1pxI90XVxv0eN5wLAEmekluP66ewP0gJg/view?usp=sharing
Book Giveaway for Participants

Those who register and attend will have the opportunity to receive a copy of the data storytelling book we’ll be using throughout the March series.
During the training, we’ll work through the book together through guided exercises, small-group practice, and collaborative discussion as participants develop stories, visuals, illustrations, and more from the data of their own lives and communities.
This is a first-come, first-served opportunity, so early registration is strongly encouraged.
The Kindle book was given away for free through the Kindle app. This makes it available to everyone, whether they can join us in person or you’re following along from anywhere.
Couldn’t Make the UNO Session? Catch Up Here
If you missed Dr. Phillips’ presentation at UNO, you can still review the materials and get excited for what’s ahead.
Slidedeck of the UNO Presentation
AI Avatar Recap by Dr. Phillips
These resources offer a strong introduction to the ideas behind the March training and a helpful recap of the themes already explored.
Made possible by
NOTCF • The PoZitive2PoSitive Initiative • The Crown Legacy Program • University of New Orleans (UNO) • NORAPC Community Coalition
Thank you for helping expand access to learning opportunities that strengthen our collective work. If you’d like short social captions or a square graphic to promote this, please type continue.


We invite you to stay connected. Visit the Crown Legacy Program website regularly to stay informed about our ongoing community work, including educational initiatives and our new Lagniappe Logic podcast. Follow our updates, join our mailing list, or reach out if you’d like to collaborate. And be sure to check out my Amazon Author Profile for details on these titles and future releases.
Together, let’s build a legacy of literacy, creativity, and transformation. Thank you for being a part of this journey. Go download your free books today – read them, enjoy them, and help us share the gift of reading with others. By turning pages, you’re helping turn the tide on illiteracy and igniting change that will resonate far beyond this month.
Joseph Santiago, Executive Director, Crown Legacy Program joe@crownlegacyprogram.org

Comments